Thermal analysis
TRM results indicate controlled board temperatures during passive cell balancing under the simulated conditions.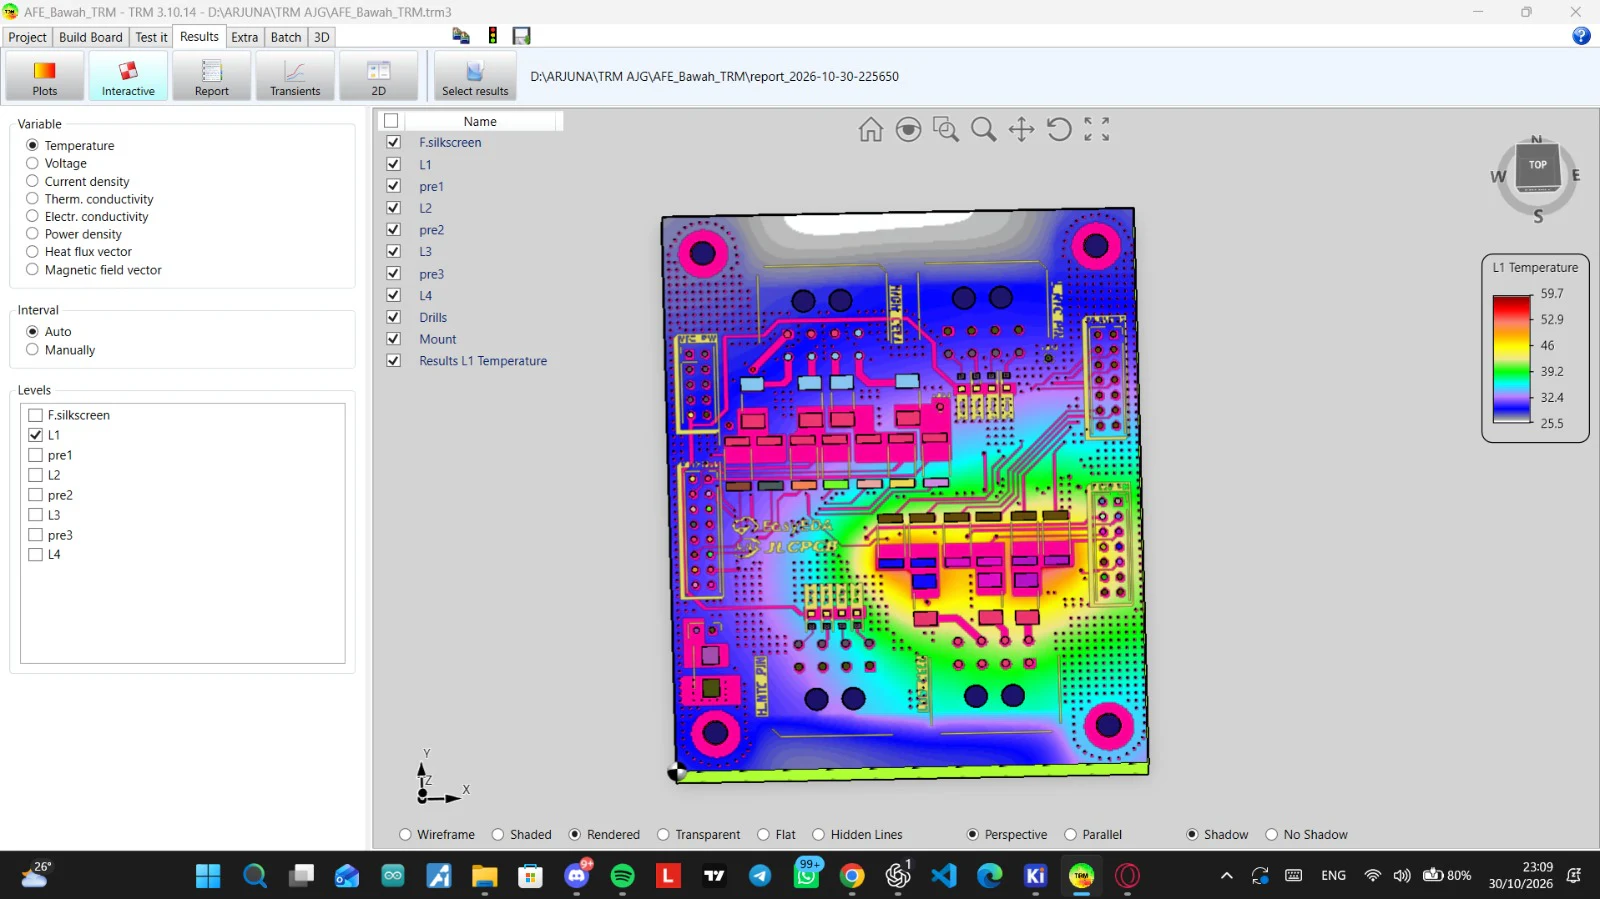
Thermal behaviour
during balancing.
The simulation results indicate that board temperatures remained controlled during passive cell balancing under the simulated conditions. Five original TRM captures document the layers, time points, and views, each with its own temperature legend.
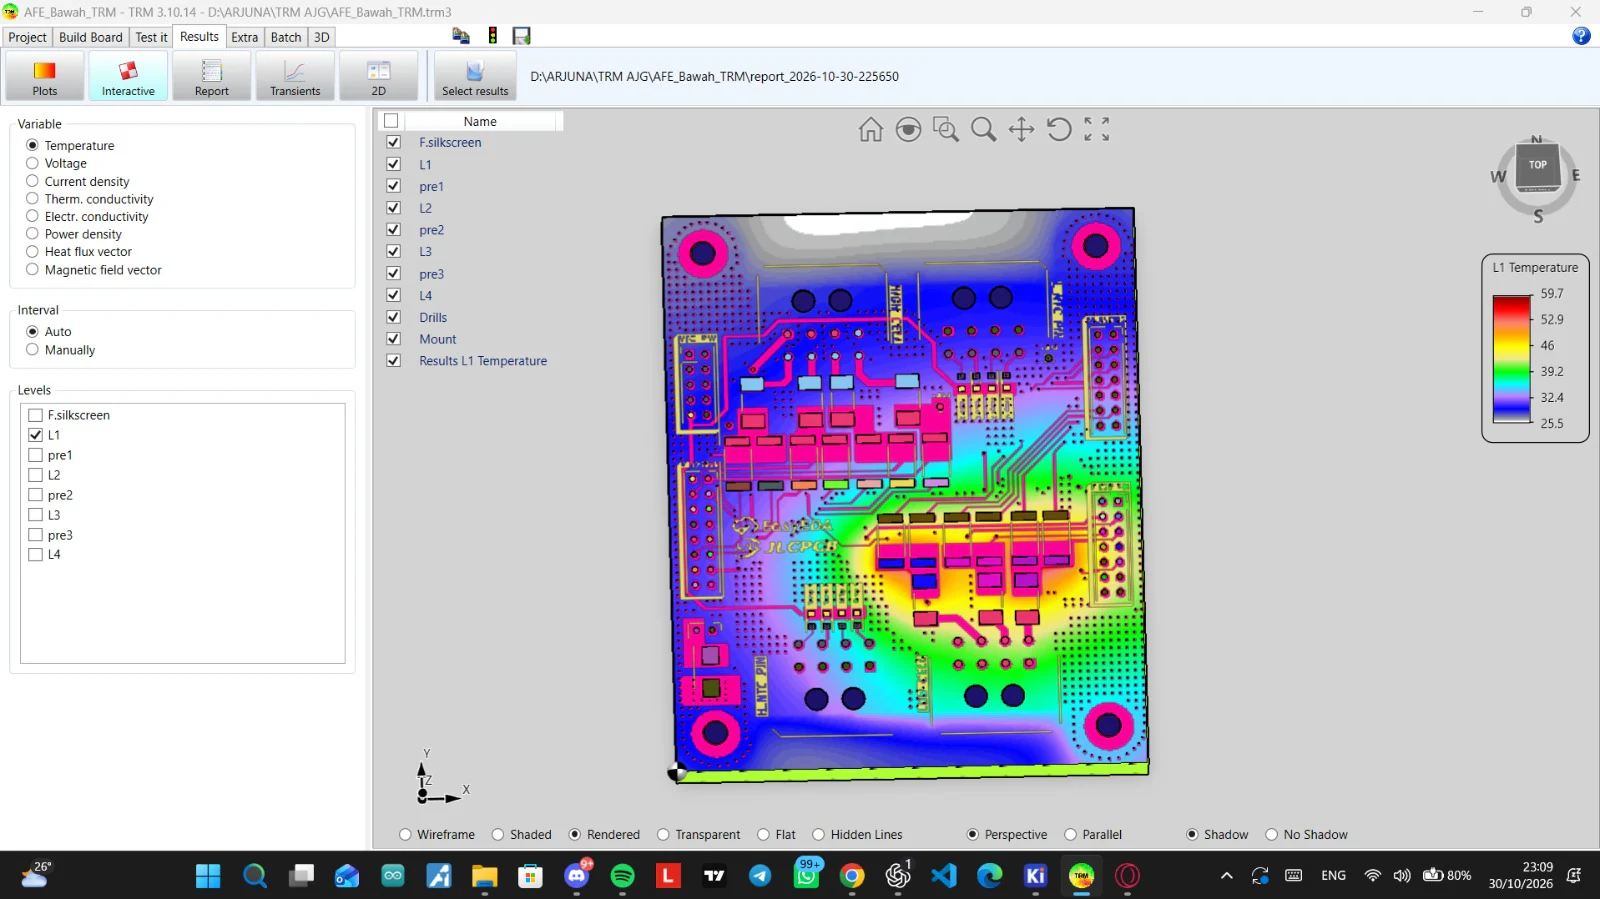
Layer L1 · 3D view
TRM rendered board view. Displayed legend: 25.5–59.7 °C.
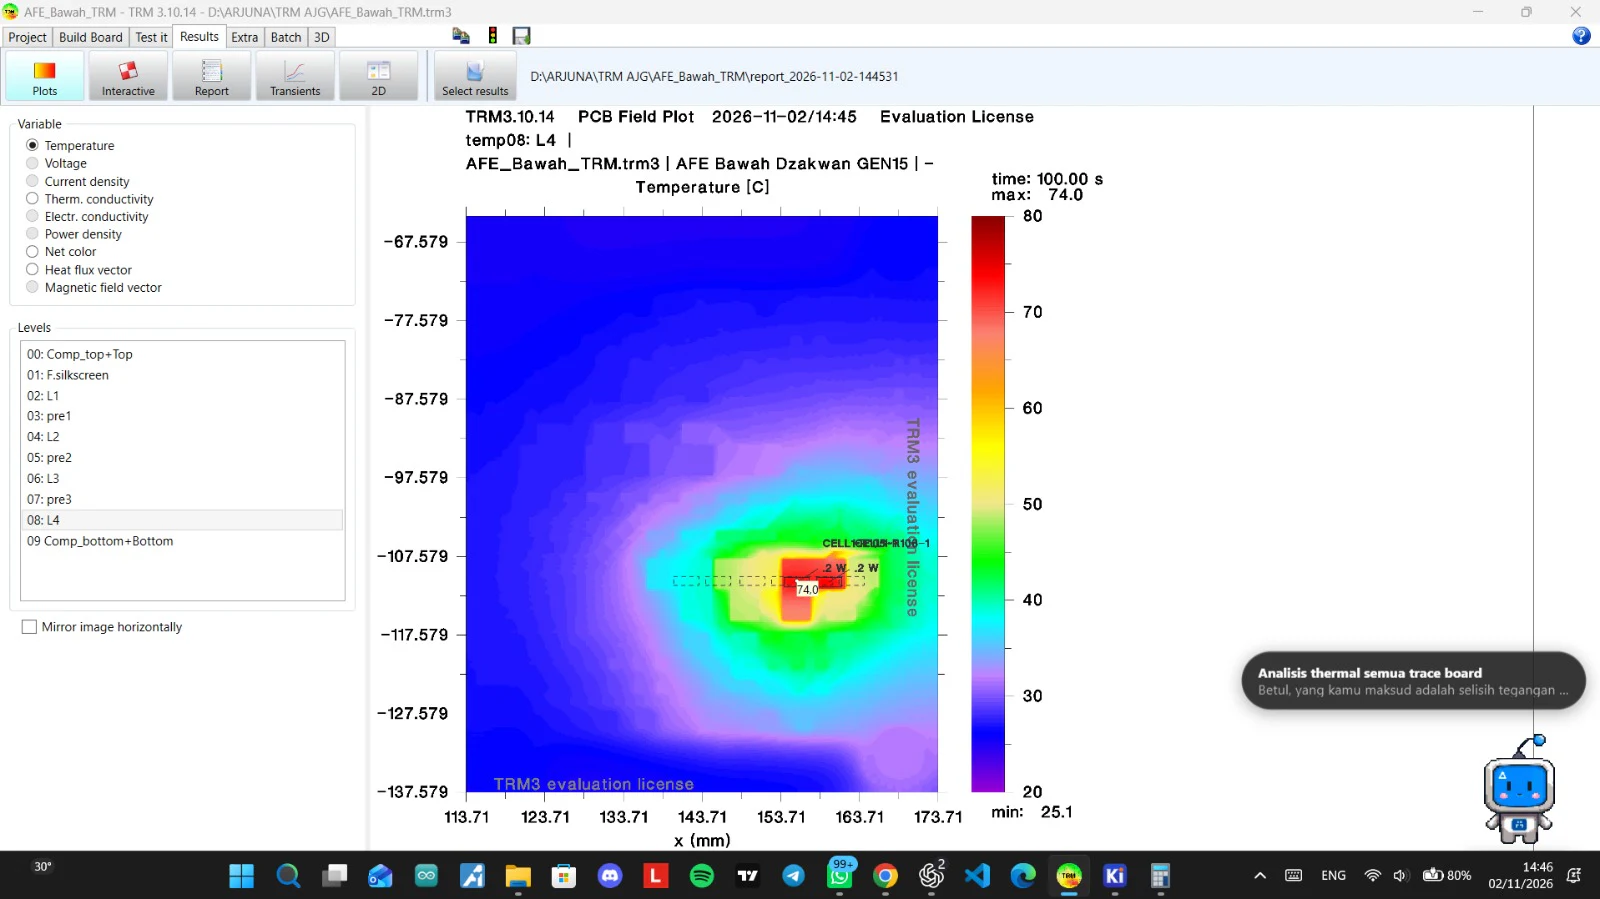
Layer L4 · 100 s
TRM field plot for the AFE lower board. Displayed range: 25.1–74.0 °C.
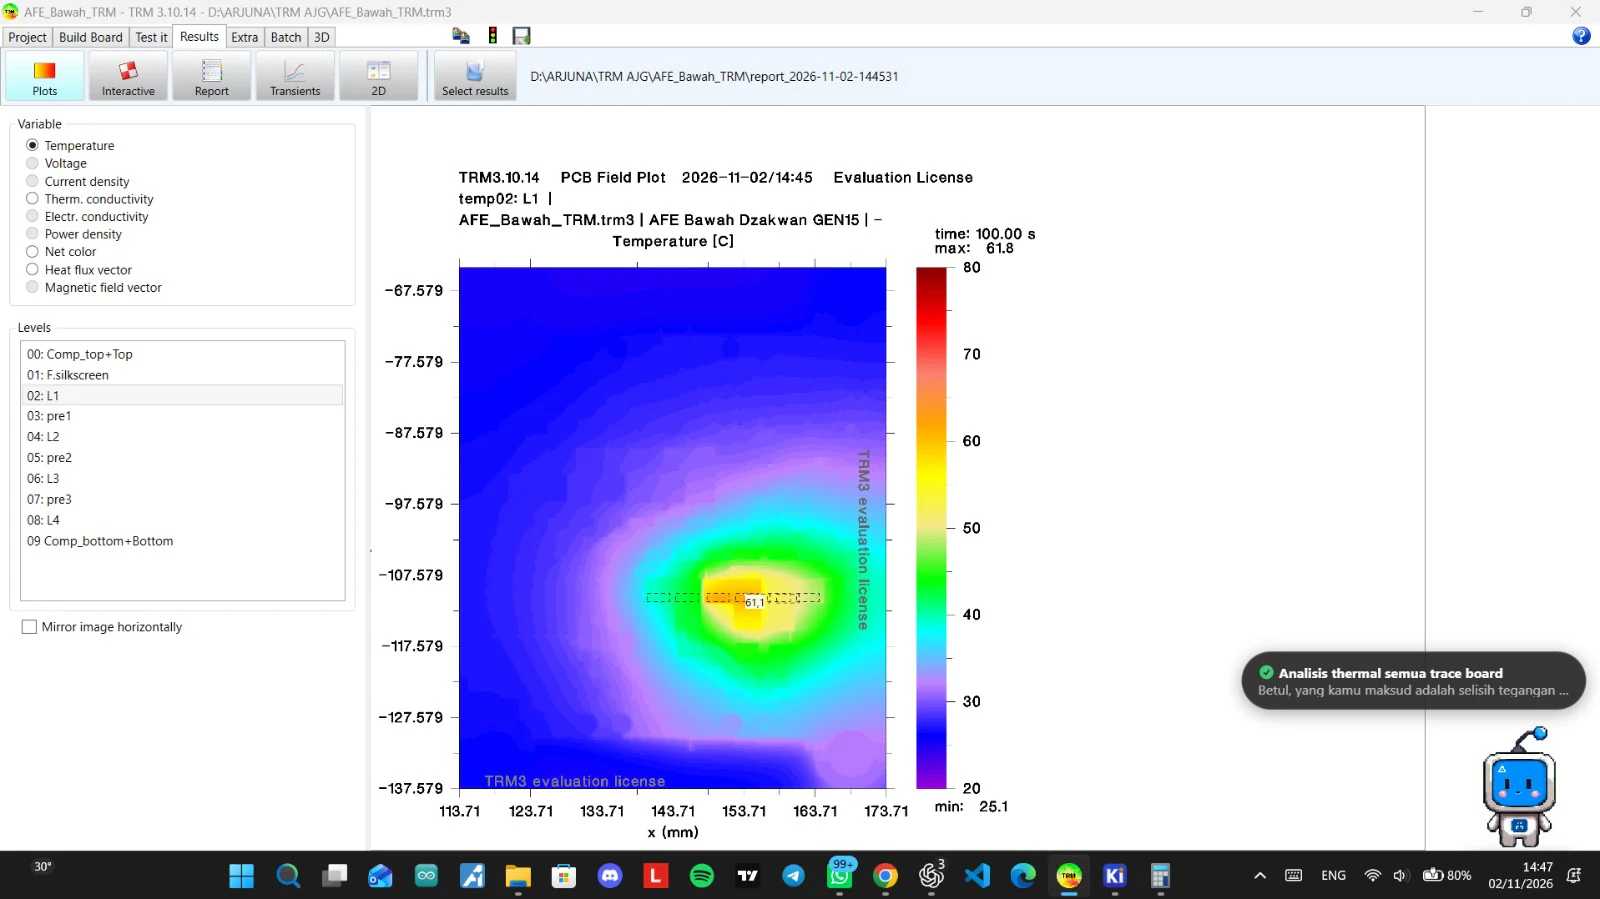
Layer L1 · 100 s
TRM field plot for the AFE lower board. Displayed range: 25.1–61.8 °C.
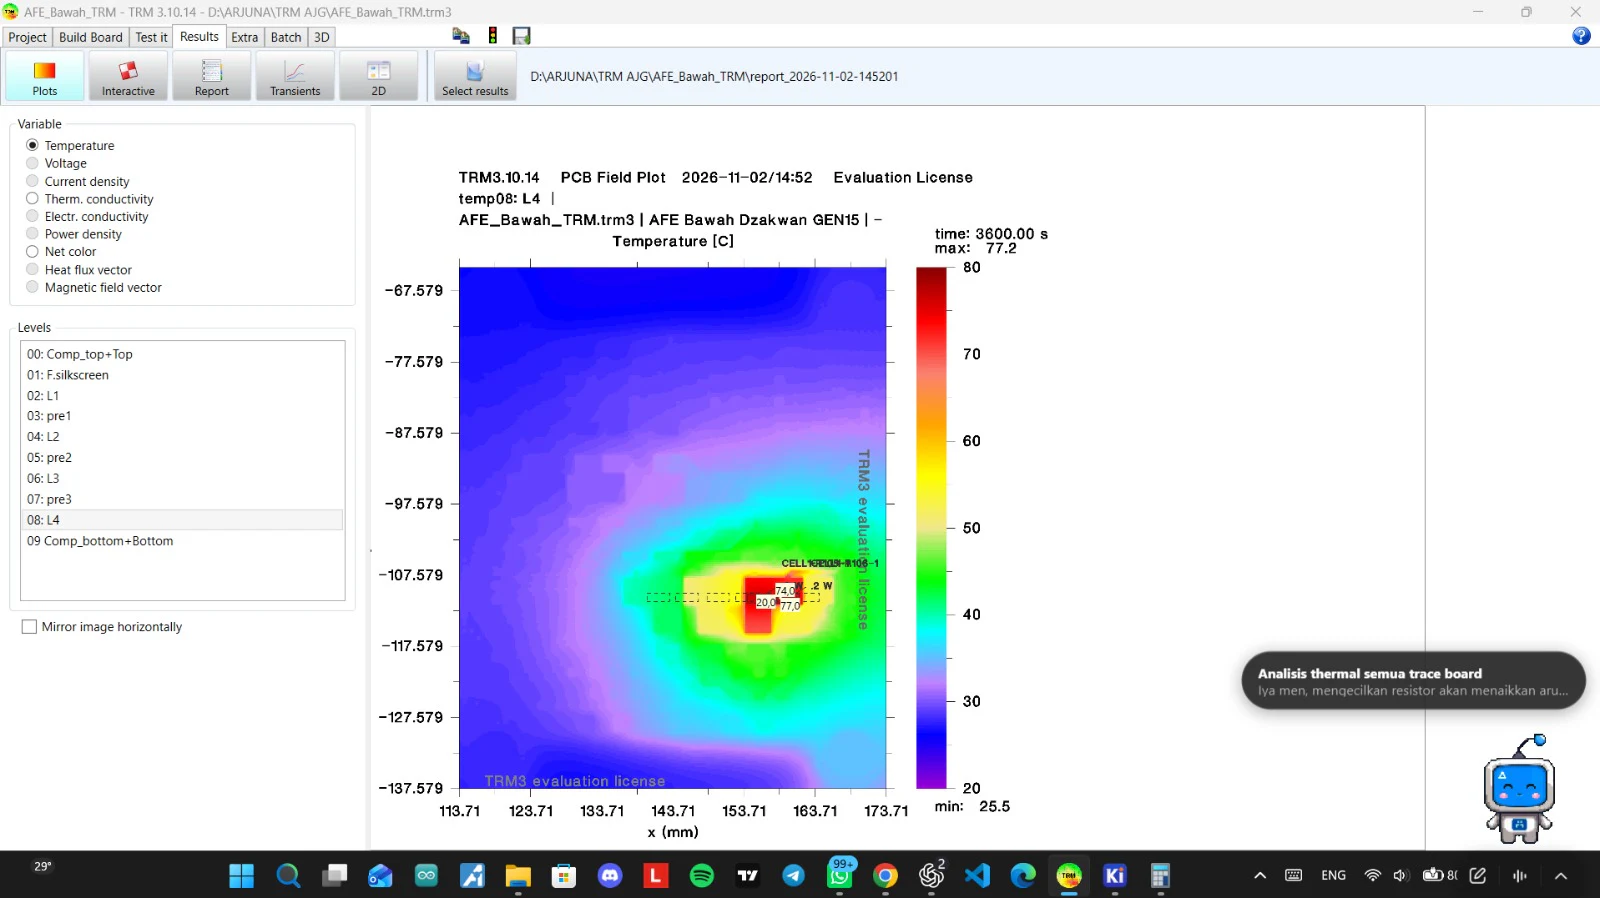
Layer L4 · 3600 s
TRM field plot for the AFE lower board. Displayed range: 25.5–77.2 °C.
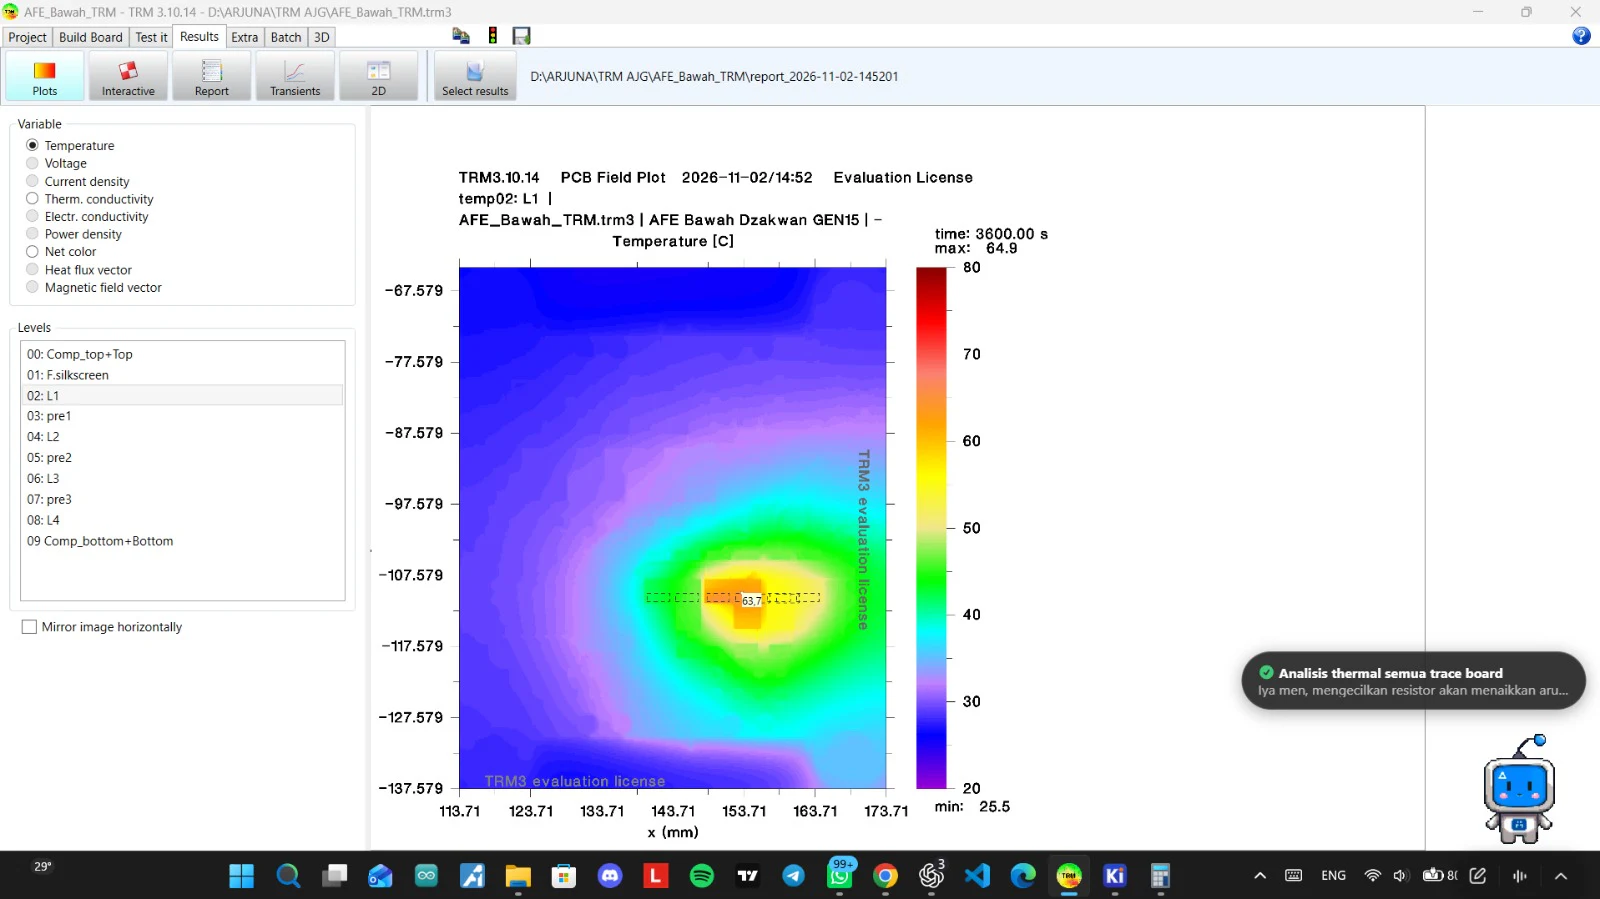
Layer L1 · 3600 s
TRM field plot for the AFE lower board. Displayed range: 25.5–64.9 °C.
Simulation evidence. Boundary conditions are not supplied, so these captures are presented individually rather than as a controlled comparison.